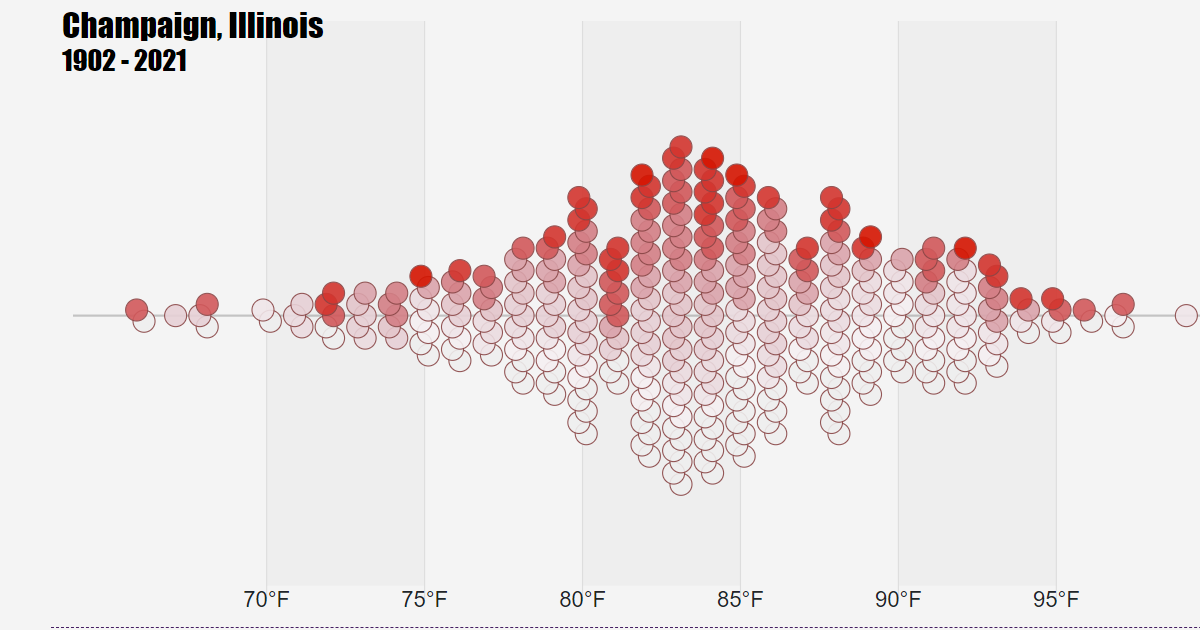
This visualization gives a historical snapshot of the current day's high temperatures. Along with the current day's temperature data, the previous and next day's temperature data is displayed.
Each dot represents a different year of available temperature data for the given location. The most common temperature for the given day will be indicated with the tallest row of dots. The dot's colors are based on the decade in which the temperature was recorded:
This visualization displays a line segment encoding the daily maximum and daily minimum temperature recorded by NOAA's National Centers for Environmental Information. For the "Temperature" color scale, the color of the line segment encodes the median daily temperature. For the "Difference from Historical Medians" color scale, the color of the line segment encodes the difference between the current year's median daily temperature and the historical median daily temperature.
Historical average temperatures for any given day are found by calculating the average of all the temperatures for that day in the entire dataset. When no line segment is displayed, the data was not reported in the dataset and was not used in calculating the historical average temperature.
The data you are currently viewing was collected from the observation site .
This project was supported by the Campus Honor’s Program Summer Research Award, awarded to Katy Miles to support undergraduate research at The University of Illinois.